
 A new approach to the data analyst profession: end-to-end ownership of analytical data flows
 Aleksandr Vasilchenko
Engineering and technologyOnline publication · October 2, 2026
Постоянные и переменные составляющие социальных издержек при перекладке трубопроводов открытым способом

Abstract
Open-cut street works impose costs on parties who are not paying for them: drivers held in a diversion, a shopkeeper whose frontage is fenced off, a household on a temporary supply. Research quantifying them ties its estimates to different physical quantities, and the categorical inventories the field presents itself through hide that difference. This review reorganises that literature for water main renewal by the quantity each estimate is tied to, distinguishing four accrual classes of cost: costs arising per street opening, per unit of trench extent, per unit of work-zone duration, and per affected receptor. Each class is crossed with the cost bearer and an evidential verdict, then tested against the terms renewal-planning models declare. Costs arising per opening and per receptor carry monetised evidence yet no grouping criterion in the reviewed models carries either, and they fail differently: the receptor class is reachable by no term those models declare, the opening class only through aggregation terms no reviewed study uses for an external cost. Against object length the classes decompose as the title announces: the per-opening class and the length-independent part of the per-receptor class form a fixed component, the per-extent class a proportional one, the per-duration class a mixed term with a length-independent floor. Dividing a programme into shorter objects raises accrual events faster than total length, and those two classes are the ones that grow.
Russian abstract
Уличные работы открытым способом возлагают издержки на стороны, которые за них не платят: на водителей, стоящих в объезде, на владельца магазина, чья витринная линия отгорожена, на домохозяйство на временном водоснабжении. Исследования, которые эти издержки количественно оценивают, привязывают свои оценки к разным физическим величинам, а категориальные инвентаризации, через которые область себя представляет, скрывают это различие. Настоящий обзор переупорядочивает эту литературу применительно к перекладке водопроводных сетей по той величине, к которой привязана каждая оценка, различая четыре класса начисления издержек: издержки, возникающие на каждое вскрытие улицы, на единицу протяжённости траншеи, на единицу длительности рабочей зоны и на затронутого реципиента. Каждый класс пересекается с носителем издержек и вердиктом о доказательной поддержке, а затем проверяется на достижимость термами, которые объявляют модели планирования перекладки. Издержки на вскрытие и на реципиента имеют монетизированные свидетельства, однако ни один критерий группировки в рассмотренных моделях не несёт ни тех, ни других, и недостижимы они по-разному: класс реципиента недостижим ни одним термом, объявленным этими моделями, класс вскрытия - только через термы агрегирования, которыми ни одно рассмотренное исследование не передаёт внешние издержки. Относительно длины объекта классы разлагаются так, как заявлено в заголовке: класс «на вскрытие» и не зависящая от длины часть класса «на реципиента» образуют постоянную составляющую, класс «на протяжённость» - пропорциональную, класс «на длительность» - смешанный терм с не зависящим от длины основанием. Деление программы на более короткие объекты наращивает число событий начисления быстрее, чем суммарную длину, и растут именно эти два класса.
Keywords
This review is written from inside the practice it examines: contracting work on the reconstruction and construction of water distribution and trunk networks by the open-cut method, carried out as a subcontractor to municipal water utilities, state enterprises and concession operators. That position determines what is visible. Traffic management schemes are designed and approved, permits obtained, residents notified, barriers erected and removed, surfaces reinstated, each on a per-opening basis, whatever the length of pipe being replaced. Operational records from that practice indicate an annual production volume between 25,000 and 40,000 linear metres, of which the open-cut method accounts for 65 to 70 per cent. These figures set the scale at which the question arises; they are not evidence for any claim made below.
What is renewed, in practice, is not a network but a list of objects: discrete pipe sections, each with its own length, each requiring its own street to be opened.
Reviews of the field inventory the social costs of that opening by category of impact, and the presentation is so established that it is easy to miss what it conceals. Reading the primary studies rather than the inventories, the estimates prove to be attached to incompatible denominators: a cost per day of lane closure, a cost per house within a distance band, a cost per intervention event, an index with no monetary unit at all. Grouped by impact category these sit together as though commensurable. They are not, and they respond differently to a change in how a programme is divided into objects.
This review therefore reorganises the literature by the quantity to which each estimate is tied. The contribution is threefold: a classification by accrual driver with an explicit assignment test; a synthesis grid crossing that classification with the bearer of the cost and a verdict on evidential support; and a test of each class against the terms renewal-planning models declare. In the reviewed literature no systematic treatment of social costs of street works ordered by accrual driver was identified, nor any examination of how such an ordering behaves when a programme is divided into objects of differing length.
The term entered infrastructure engineering through a practical dispute. Trenchless methods cost more per metre than open-cut excavation, and the case for them rested on costs falling outside the contractor's bill; quantifying those costs was the way to make the comparison, and a foundational state-of-the-art review consolidated that effort (Gilchrist & Allouche, 2005). The framing shaped what got measured: costs differing sharply between an open trench and a bore attracted models, and costs both methods incur similarly attracted fewer.
That inheritance persists. A critical review of multi-utility tunnels reports the claim that such tunnels reduce maintenance interventions by 70 to 80 per cent as a claim, traced to sources from 1992 and 2012, and notes that the cost comparison against open-cut excavation is itself contested, one source putting the tunnel at 80 per cent more expensive and another at 50 per cent (Bergman et al., 2022). Its contribution is the refusal to average those figures. That device, a verdict on evidential support attached to each claim rather than a pooled estimate, is borrowed here and applied to the accrual classes.
Later work broadened the object: social costs inventoried for construction generally (Çelik et al., 2017), assessed for pipeline infrastructure projects (Matthews et al., 2015), monetised phase by phase for residential construction (Çelik et al., 2019), and framed across stakeholder categories (Wu et al., 2022). Three works come closest to this review's question and each leaves it open. The foundational review asks which social costs exist and how they have been quantified, taking the construction project as its unit, and does not ask which quantity each estimate is tied to (Gilchrist & Allouche, 2005). A recent systematic review states its focus as above-ground building projects, so linear street works fall outside it (Weissinger et al., 2024). The sectional work-zone model takes the 100 m section and the day as its units and declares economies of scale in its objective rather than deriving them from costs that accrue per event (Nakazato & Mizutani, 2024). Closest of all, a pricing mechanism for road closures assigns a price to the closure event itself from accessibility losses (Alitani et al., 2025); it prices an event, but a road closure is not a street opening within a renewal programme, and the mechanism does not ask how that price behaves when the programme is cut into more objects.
Linear street works for buried utilities are a different substrate: the work is a corridor rather than a site, the corridor is a road, and the road is reopened repeatedly by different undertakers. It is there that the accrual question becomes sharp, because a corridor has a length and a site does not. Trenchless technology appears throughout as the comparison that generated the literature; it is not the subject, and no recommendation to adopt it follows from anything below.
3.1. Corpus construction and screeningThe corpus is purposive and bounded, not exhaustive. Candidate records were retrieved from the OpenAlex bibliographic index, which aggregates Crossref and other sources, using eight topical queries across social cost in construction, street works and excavation, work-zone and road-closure user costs, pavement damage from utility cuts, water main renewal scheduling and grouping, the open-cut and trenchless comparison, business and resident disruption, and buried-utility strikes, plus two queries directed at prior reviews. That retrieval returned 399 records, of which 386 were distinct; of twenty studies identified in advance as anchors, six were already present and fourteen were added, giving a pool of 400. Filters on year, record type and availability of an abstract reduced it to 356, and screening against the inclusion criteria to 41. Screening on abstracts alone discards work the index holds no abstract for, which here includes several of the most cited items; eleven studies removed on that ground were reinstated by name, giving a working set of 52, from which 27 are cited.
Thirteen studies were examined in full text, because assignment to an accrual class cannot be made from an abstract: the quantity to which a cost is tied is stated in the methods. Every number below was located in the full text of the study it is attributed to and checked against the sentence carrying it. The remaining studies were analysed at the level of their reported results, so their classification carries more uncertainty. Assignment is one reader's interpretation, without a second coder; Table 2 records the evidence for every entry.
A study qualified if it quantified, modelled or inventoried costs of urban street works falling on parties other than the works promoter; or addressed pavement deterioration or damage charging from utility cuts; or scheduled, grouped or prioritised water main renewal under a declared cost objective; or reviewed the quantification of social cost in construction. Wastewater networks lie outside the subject, but part of the strongest work on grouping is built on sewer assets; those studies are used for their method, and the substrate difference is stated where they are cited. Statements about the absence of a cost term were tested by a dedicated search over four cost terms combined with five renewal activities, not asserted from a general query.
The classification proposed here, shown in Figure 1, sorts social costs by the physical quantity whose increase adds cost.
The assignment test is a single counterfactual, stated so that any reader can apply it to a study this review does not cover: if the same works were carried out over twice the length, or split into two street openings instead of one, in which direction would this cost move?
D1, per street opening. Metered on the event of opening a street, indifferent to how much pipe is laid once it is open: traffic management scheme design and approval, permit acquisition, diversion signage, notification of residents and connected customers, mobilisation and demobilisation, and any charge for reopening a recently reinstated surface.
D2, per unit of trench extent. Metered on the metre of trench or the unit of reinstated surface: structural degradation of the pavement over the opened area, spoil removal, dust and noise along the length under excavation, and the area of amenity reinstatement.
D3, per unit of work-zone duration. Metered on the day the working zone occupies the corridor: delay and vehicle operating costs, trading losses of frontage businesses, and loss of parking and access, each per day.
D4, per affected receptor. Metered on the affected household, frontage or connection: temporary water supply per disconnected customer, notification per adjacent resident, risk of damage to adjacent utilities per crossing, and provision of access per entrance.
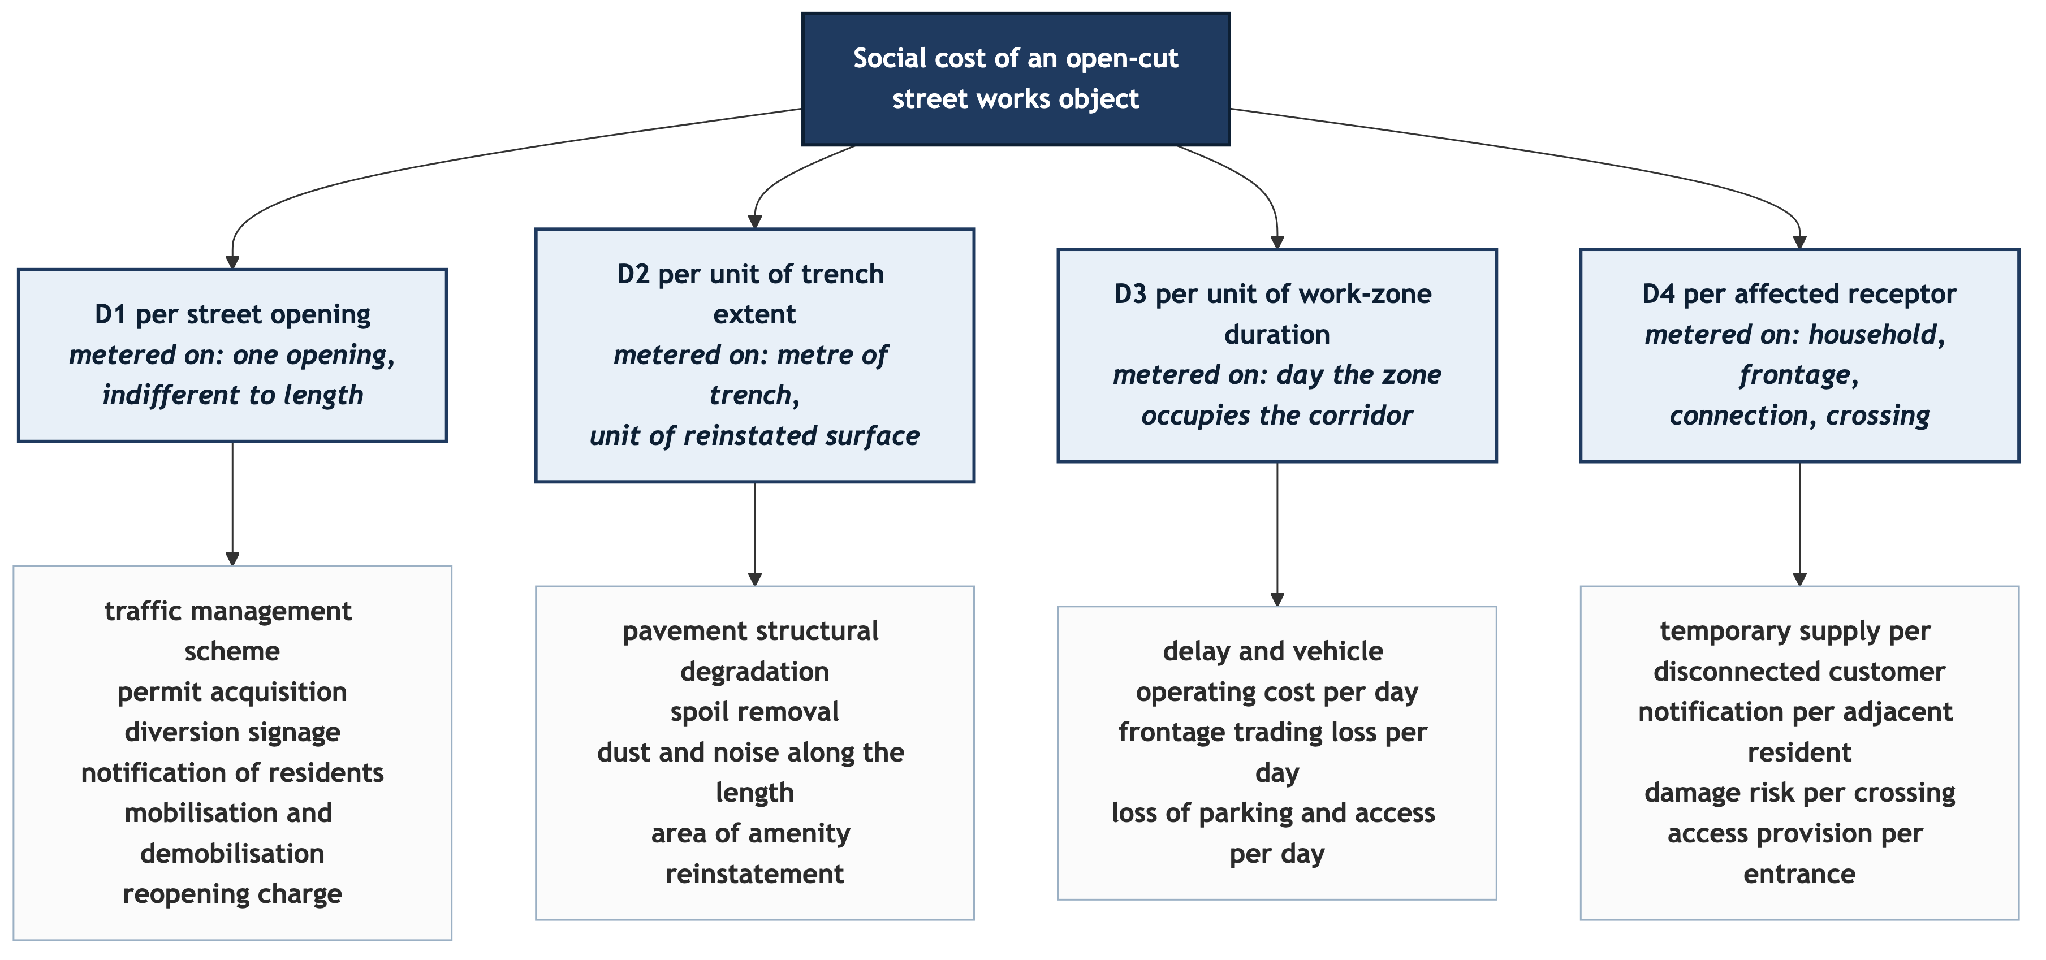
One property must be stated before the classification is populated. The classes are complete with respect to the units of account the reviewed corpus declares, not with respect to the field: every declared denominator observed in the studies read for this review falls into one of the four. That is a claim about saturation of a bounded corpus, and a single study declaring a unit of account outside this set would extend the taxonomy rather than refute it. It is stated here, where the classification is introduced, rather than deferred to the limitations.
The clearest evidence that a substantial cost is metered on the opening itself comes from studies pricing the elimination of separate openings. A prototype appraisal tool for joint occupation was applied to two schemes combining works by different undertakers into a single occupation of the corridor: a gas main replacement of 3.74 km combined with a carriageway resurfacing of 3 km yielded a saving of £1.51 million on monetised economic indicators and a socio-economic net benefit score of 8.36, and six sets of works involving twelve infrastructure owners yielded £0.255 million and a score of 4.23 (Moran et al., 2017). The saving is generated by not opening the street more than once. Nothing about the quantity of pipe changed.
The same study states where the field's measurement stops: its authors record that changes in road-use costs associated with pavement surface condition were not calculated, because it would be "problematic to quantify and compare these for multiple single openings and joint occupation". The comparison that most directly tests the per-opening class is the one the study declined to make.
Utility strikes give the class its most striking ratio. Sixteen fully documented strike case studies in urban areas were analysed to separate direct repair cost from indirect and social cost, and the aggregated ratio of indirect and social cost to direct repair cost was 29:1; in one water-utility case the direct cost was £750 against £2,000 of indirect cost (Makana et al., 2020). A strike is an event of excavation, not a quantity of pipe: it occurs when a machine meets a service, and the probability of that meeting is governed by how often the ground is opened. That the disruption attaches to the intervention rather than to its size is stated independently: coordinated management is rational "considering costs and disruption of services and communities caused by each intervention on the different assets" (Daulat et al., 2024).
Renewal-planning research shows how strongly the count of openings can move without any change in the quantity renewed. A pipe-grouping methodology assembled 397 individual segments into 46 rehabilitation units under an annual budget of 250 k€ (Caetano et al., 2023): the intervention count is smaller by nearly an order of magnitude than the segment count, and the criteria driving that consolidation are budget and connectivity, with no cost computed outside the utility. Work-zone scheduling treats the same effect as a premise, incorporating economies of scale with user cost over a 365-day horizon (Nakazato & Mizutani, 2024; Mizutani et al., 2020); scale enters as a declared property of the objective function, so the magnitude of the per-opening class stays unexamined even in a study whose objective depends on it.
Costs metered on trench extent are the ones the industry measures most comfortably, because they coincide with how work is priced and paid.
The most developed body of measurement concerns pavement. Work in the late 1990s established that an excavation shortens the service life of the surrounding surface by an amount attributable to the cut itself (Arudi et al., 2000; Chow & Troyan, 1999), and that tradition continues in damage-fee development, where the deterioration is converted into a charge levied on the undertaker (Dunn et al., 2024). What is measured is an area of disturbed surface, and the charge follows the same quantity. The instrument also sits across the D1 and D2 boundary in a way its own literature does not emphasise: a damage fee is levied per cut and computed from the area of that cut, so the trigger is the event while the magnitude is the extent.
Renewal-planning models meter on extent throughout. A life-cycle cost optimisation of pipe replacement scheduling was applied to a network of 6,326 pipes totalling 812.5 km under annual budget constraints of 2.5, 2.2 and 2.0 M$; the resulting schedules increased life-cycle cost by 0.08, 0.27 and 1.06 per cent relative to the least life-cycle cost solution (Ghobadi et al., 2021). The grouping study reports that under a 150 k€ budget the network resolves into 72 rehabilitation units, an average annual rehabilitation rate of 1.4 per cent (Caetano et al., 2023). Every one of these quantities is metered on length or on the money that length consumes, and every one is borne by the network owner.
The cell that stays empty is instructive. No study was identified that meters a cost on trench extent and assigns it to adjacent residents or businesses. Dust, noise and obstruction along a length are named as impacts in the categorical inventories (Çelik et al., 2017), but where monetised at all they are monetised per day of exposure or per affected property, which places them in D3 or D4. Extent, for the receptor, is not the operative quantity: a household is not twice as disturbed because the trench continues past the neighbour's frontage.
Duration is where the field's measurement is densest and its monetisation most mature, because the road-user cost tradition supplies both a method and published unit rates.
One study working from a state highway agency's procedures reports two distinct sets of rates: the agency's user cost per hour per vehicle, $11.43 in 1995, carried forward to $21.01 for 2019 by the ratio of consumer price indices, and separately its vehicle-type values of time, $12.92 for automobiles and $22.36 for trucks. Across four rehabilitation projects on routes carrying fewer than 10,000 vehicles per day, road user costs came to less than $4,000 per day, with lane closure length administratively capped at 3.22 km (Choi, 2020).
The structure of that computation is what matters. Value of time multiplied by delay multiplied by traffic volume yields a cost per unit of time that the closure exists. Length enters only through the extent of the closure, and that is capped administratively rather than by the works: doubling the pipe laid inside an existing closure does not double this cost, while extending the closure by a day does. Work-zone scheduling formalises the same denominator, treating each day of a 365-day horizon as a decision variable (Nakazato & Mizutani, 2024).
Not every study in this class monetises. A decision-making method for minimising the social impact of construction work on mobility builds a weighted index rather than a monetary figure, weighting emergency vehicle access at 33.4 per cent, mass transit at 23.9 per cent, pedestrians at 15.9 per cent, individual transport at 14.7 per cent and bicycles at 12.1 per cent (Casanovas-Rubio et al., 2020). It declares its unit of account as an index over affected trips per day of occupation and declines to attach money to it, which is a description rather than a criticism: its stated purpose is to rank alternatives, and an index serves that purpose.
Duration is the class where the relationship to length is genuinely mixed. It grows with the length of the object, since more trench takes more days to excavate, lay, test and reinstate, but it also carries a component independent of length: setting up and removing the working zone, waiting for approvals, testing, reinstating and demobilising consume days governed by the fact of the work rather than by its quantity. A short object therefore carries a duration floor, and that floor is why D3 cannot be assigned wholly to either side of the decomposition. No study in the corpus separates the two parts for buried-utility street works; the scheduling literature takes duration as an input to optimise over, not a quantity to explain.
The receptor class has the strongest evidence at the level of the individual affected party and the weakest presence in renewal planning.
The distance-banded evidence is the most developed. A study of business survival along a rail construction corridor tracked establishments in rings of 150, 305, 400 and 800 metres, and the 400-metre band carries the strongest effect in both its models: a logistic model of survival through construction puts businesses within 400 metres at 76 per cent more likely to fail, rising to 85 per cent once size and sector are controlled for, against 44 and 55 per cent at 305 metres; a discrete-time event history model, which also controls for time and location, returns 46 per cent at 400 metres and 28 at 305 (Ray, 2017). The unit of account is the establishment at a distance from the works, not the metre of works.
Monetisation at the level of the dwelling exists: building construction in residential areas is reported to incur £6.25 per day for each house within 150 metres of the site (Çelik et al., 2017). That figure is a per-receptor and per-day rate at once, which shows that D3 and D4 are a pair rather than exclusive coordinates: an exposure count multiplied by an exposure duration.
Where the receptor is a connected customer rather than a bystander, the water-specific literature has begun to count. A digital-twin-supported planning strategy evaluates replacement plans by the network segment that must be isolated to execute the work, and its efficiency index expresses replaced pipe length against the length of network isolated; across the reported plans it ranges from 0.026 to 0.979 (Messa et al., 2026). In one plan, replacing roughly 200 m forced isolation of the entire containing segment together with terminal segments reachable only through it, scoring 0.030 and leaving 476 users in pressure deficit; that case, the authors write, "clearly demonstrates how limited isolation capability and incomplete valve information can lead to disproportionate service impacts, even for limited rehabilitation interventions". The lowest index, 0.026, comes from a plan in which about 2 km of replacement required isolating some 80 km, which the authors describe as unrealistic and read as a data-quality alert, so it is recorded here as such rather than as evidence of the mechanism. The mechanism rests on the ordinary plans: the number of receptors cut off is governed by valve topology, not by trench length.
The partial dependence between the receptor and extent classes is the classification's most obvious point of attack. Within a corridor of given frontage density, a longer trench does pass more properties. Two considerations keep the classes apart: several receptor-metered items are triggered once per receptor irrespective of length, one temporary supply connection per building, one notification per customer, one crossing per intersecting service; and the isolation evidence shows the coupling breaking entirely where network topology, rather than frontage, determines who is affected. Corridor type is the analytical substitute for geography here: frontage density, trading premises, the availability of a parallel route and the seasonal pattern of use differ between a densely built urban corridor and a coastal recreational one, and those differences change receptor counts per metre without changing anything about the pipe. Conditional statements about receptor-metered costs are therefore available; unconditional per-metre rates are not.
Crossing the accrual classes with the party that bears the cost produces Table 1. The bearer dimension distinguishes road users (B1), adjacent residents and businesses (B2), the network owner with the road authority and other utilities in the corridor (B3), and society and the environment diffusely (B4); it is an analytical dimension of the present review rather than a published scheme, though the case for treating the bearer as a dimension in its own right is made by Wu et al. (2022), whose own reporting is organised by impact category rather than by bearer.
| B1 road users | B2 residents and businesses | B3 owner, road authority, other utilities | B4 society and environment | |
|---|---|---|---|---|
| D1 per opening | £1.51 m and £0.255 m saved by combining occupations, monetised (Moran et al., 2017) | Community indicators in the same appraisal, modelled (Moran et al., 2017) | Strikes: 29:1 over 16 cases, £750 direct against £2,000 indirect in one water case, monetised per case, a ratio in aggregate (Makana et al., 2020); 397 segments into 46 units, modelled, no external cost (Caetano et al., 2023) | Maintenance interventions claimed to fall 70‑80 % under utility tunnels, asserted (Bergman et al., 2022) |
| D2 per unit of extent | (empty: deterioration reaches road users, but none identified monetises it per unit of extent) | (empty: no study identified metering a receptor cost on trench extent) | Service-life loss converted into a charge on the undertaker, monetised (Arudi et al., 2000; Chow & Troyan, 1999; Dunn et al., 2024); life-cycle cost over 6,326 pipes and 812.5 km at 2.0‑2.5 M$/yr, monetised, internal (Ghobadi et al., 2021) | Spoil, dust and noise named per length in inventories, asserted (Çelik et al., 2017) |
| D3 per unit of duration | Road user cost below $4,000/day at VOT $12.92 car and $22.36 truck, monetised (Choi, 2020) | £6.25 per house per day within 150 m, monetised (Çelik et al., 2017); frontage revenue losses of 2‑84 %, modelled, a percentage range not a rate (Ray, 2017) | 365-day sectional scheduling, economies of scale declared in the objective, modelled (Nakazato & Mizutani, 2024) | Mobility index weighting emergency access 33.4 %, mass transit 23.9 %, pedestrians 15.9 %, modelled, an index (Casanovas-Rubio et al., 2020) |
| D4 per receptor | (empty: no study identified metering a road-user cost per receptor) | Failure risk at 400 m: +76 % logistic, +85 % with controls, +46 % event history, modelled, odds ratios not a rate (Ray, 2017); one plan leaves 476 users in pressure deficit while about 200 m is replaced, modelled (Messa et al., 2026) | 177 segments requiring isolation across the case, modelled (Messa et al., 2026) | (empty: no study identified metering a diffuse societal cost per receptor) |
Four empty cells and two asserted-only cells are the map's substantive output. The empty receptor-on-extent cell is a property of the phenomenon: exposure is not proportional to the length of a neighbour's trench. The empty road-user-on-extent cell reflects where the pavement literature stops, converting surface deterioration into a charge on the undertaker rather than a user cost per metre. The remaining two mark a measurement boundary, not an absence of interest.
Table 2 records, for a cross-section of the corpus, the class assigned to each cost item and the evidence in the source for that assignment.
| Cost item | Class | Evidence of assignment in the source | Bearer | Verdict |
|---|---|---|---|---|
| Combining separate occupations into one (Moran et al., 2017) | D1 | Saving computed from eliminating repeat occupation, not from quantity laid | B1 - B3 | monetised |
| Road-use cost of pavement condition across differing numbers of openings (Moran et al., 2017) | D1/D2 | Excluded by the authors as "problematic to quantify and compare" across the two cases | B1 | not computed |
| Utility strike, indirect and social cost (Makana et al., 2020) | D1 | Cost attaches to a strike event during excavation | B3, B1 | monetised per case; the 29:1 aggregate is a ratio |
| Business failure risk by distance band (Ray, 2017) | D4 | Odds per establishment within 150/305/400/800 m rings | B2 | modelled |
| Customers isolated for a replacement (Messa et al., 2026) | D4 | 476 users in pressure deficit while about 200 m is replaced; count set by the isolable segment | B2 | modelled |
| Cost premium of a utility tunnel over open-cut (Bergman et al., 2022) | not declared | Two sources give 80 % and 50 %; base of comparison not reconciled | B3 | asserted, contested |
| Social cost categories in construction inventories (Çelik et al., 2017; Gilchrist & Allouche, 2005) | not declared | Categories listed by impact type without a unit of account | B1 - B4 | asserted |
| Social cost of pipeline infrastructure projects (Matthews et al., 2015) | not declared | Assessment framed at project level | B1 - B4 | modelled |
| Life-cycle social cost across stakeholder categories (Wu et al., 2022) | not declared | Impact categories reported; no stakeholder-level unit of account stated in the accessible text | B1 - B4 | modelled |
Four of the nine registry entries declare no unit of account at all, and they include the field's most cited framing works. A reader coming to this literature through its reviews meets the categorical inventories first, and does not learn from them which quantity any figure is tied to.
Admissibility to the renewal decision is a separate question from evidential status, and Table 3 answers it. Renewal-planning models declare a small number of terms, and a social cost class can inform such a model only if some declared term can carry a quantity metered the way that class is metered.
| Declared term | D1 per opening | D2 per extent | D3 per duration | D4 per receptor |
|---|---|---|---|---|
| Deterioration and failure risk (Ghobadi et al., 2021; Carriço et al., 2021) | no | yes, condition is metered on pipe and length | no | no |
| Aggregation into intervention units (Caetano et al., 2023; Nafi & Kleiner, 2010) | yes, the unit is the intervention | partial | no | no |
| Economies of scale and adjacency (Nafi & Kleiner, 2010; Kleiner et al., 2010; Nakazato & Mizutani, 2024) | yes, scale is counted over combined interventions | partial | partial, the day is a decision variable in work-zone scheduling | no |
| Annual budget constraint (Caetano et al., 2023; Ghobadi et al., 2021) | partial | yes, money per length per year | no, the renewal budget horizon is annual and no renewal budget term has a daily counterpart | no |
| Multicriteria assessment metrics (Carriço et al., 2021) | no | yes | no | no |
| Overall | reachable | reachable | partially reachable | not reachable by any term these models declare |
The last column is the finding this grid was built to expose, and it is a statement about these six models rather than about the field: the planning strategy discussed in Section 4.4 does count affected users, but on isolable network segments, not through any term the models in this grid declare. Two of the six show what "borne inside the utility" means concretely. A multicriteria decision analysis for the rehabilitation of a water main selected, with the utility's experts, nine assessment metrics: hydraulic capacity adequacy, system storage capacity, infrastructure value index, real water losses, structural condition, probability of service disruption, risk of pipe burst, operation and maintenance costs, and capital costs (Carriço et al., 2021). Every one is borne inside the utility; even the probability of service disruption is framed as system redundancy rather than as a cost to a customer. A pipe replacement scheduling study declares three objectives: minimum imposed life-cycle cost on the network, minimum standard deviation of annual investment, and minimum average age of the network (Ghobadi et al., 2021). The first two are the utility's money and the smoothness of its spending, the third the condition of its own asset. No party outside the utility appears in any of the three.
The term is not absent from the field, and a targeted search over four cost terms combined with five renewal activities confirms it: a framework for temporal coordination of water, sewer and road interventions, the sewer component lying outside this review's subject, is built on the social and economic impacts of renewal activity on surrounding communities (Osman, 2016), an integrated municipal asset-management framework addresses the same problem (Abu-Samra et al., 2020), and the digital-twin strategy counts affected users directly (Messa et al., 2026). What the literature does not supply is a social cost term metered in a unit commensurable with the decision that determines how many streets get opened: coordination frameworks operate on the calendar, grouping models on budget and connectivity, and the study that counts affected users meters them on isolable segments. None is a cost per street opening, and the per-opening class is where the joint-occupation appraisal found savings of £1.51 million.
Four questions follow from the empty and asserted cells: a unit rate per street opening separating the cost of the event from that of its extent; decomposition of work-zone duration into its length-dependent and length-independent parts; receptor counts derived from network topology rather than frontage, for which the isolation-efficiency approach supplies a method; and reconciliation of the contested cost premium between construction methods, where two published figures differ by thirty percentage points on an unreconciled basis.
Reading the four classes against the length of a single renewal object yields the decomposition the title announces, and it follows from the assignment test rather than from any measurement (Figure 2).
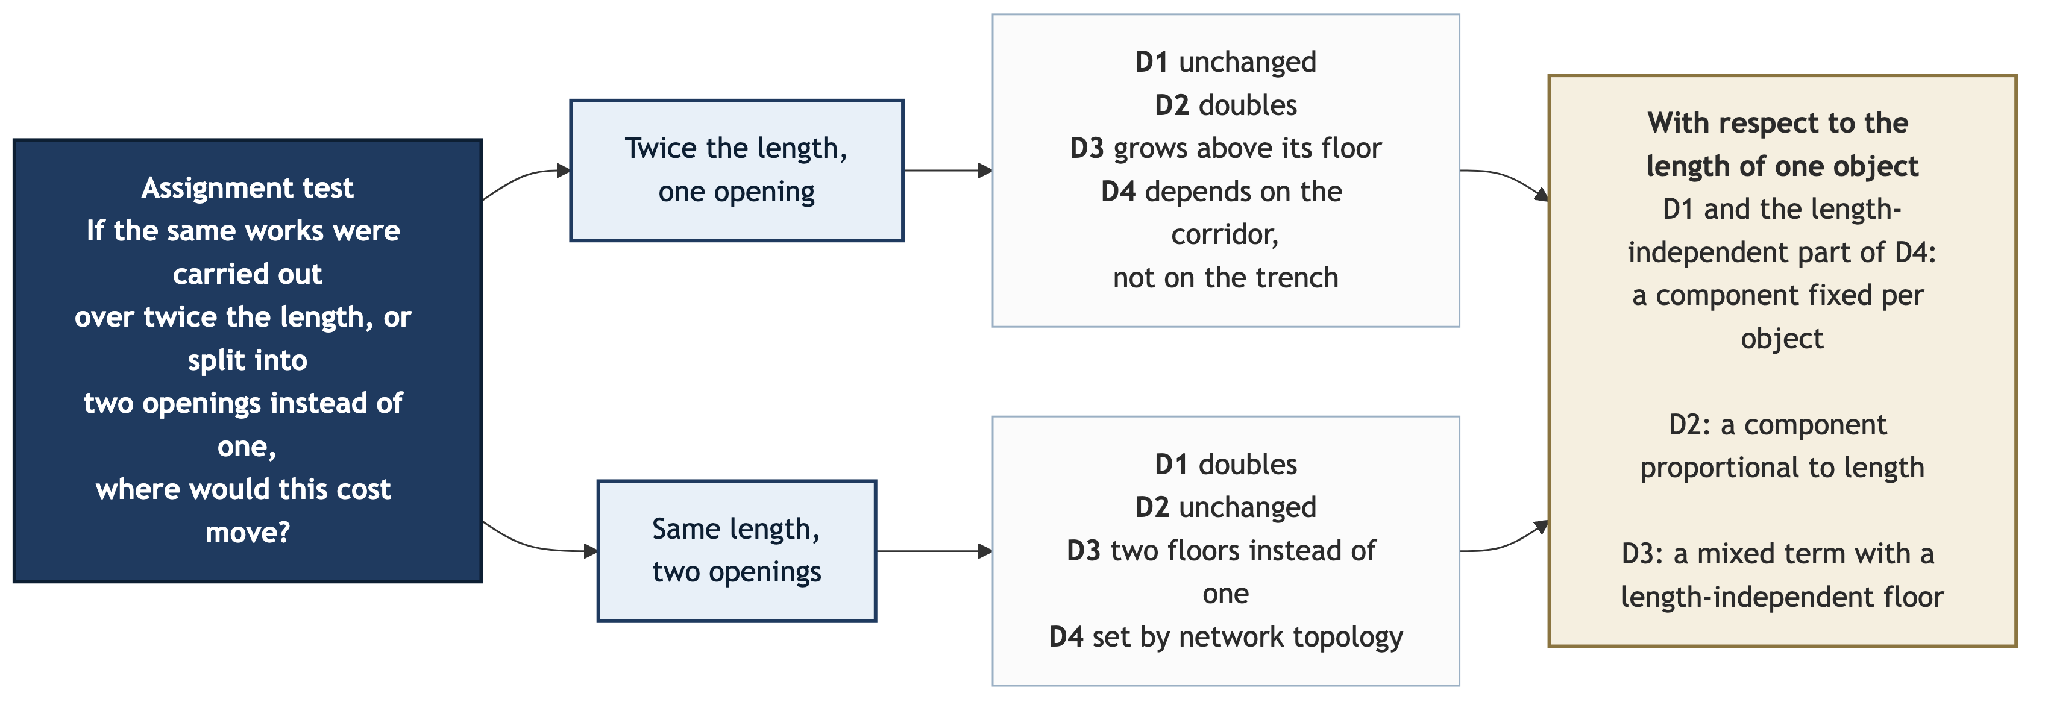
Costs in D1 arise once per street opening: their magnitude is set by the fact that a corridor is opened, permitted, signed, notified and mobilised, and does not change when more pipe is laid through the same opening, so with respect to the length of an individual object they are a fixed component. The length-independent part of D4 behaves the same way. Costs in D2 are metered on the metre and are proportional by construction, and costs in D3 are mixed, carrying a component that grows with the work and a floor that does not.
Two consequences follow, and both are dependencies rather than measured effects. The first concerns the individual object: where a fixed component exists, its share of cost per metre rises as the object shortens, because the same fixed magnitude is divided by fewer metres. What the corpus supports is the sign of that relationship and the identity of the cost items on each side of it; the magnitude, and any ratio between the fixed and proportional parts, would require a measurement the corpus does not contain.
The second concerns the programme. A renewal programme is executed as a list of objects, and the number of street openings it generates is a property of how that list is cut, not of its total length: dividing it into more and shorter objects raises the count of accrual events faster than total length, because the event count rises with the number of objects while length is merely redistributed among them. The grouping literature shows the magnitude available on this axis from the opposite direction: 397 segments resolve into 46 rehabilitation units under one budget and 72 under another (Caetano et al., 2023), and combining occupations produced savings of £1.51 million and £0.255 million in two appraised schemes (Moran et al., 2017).
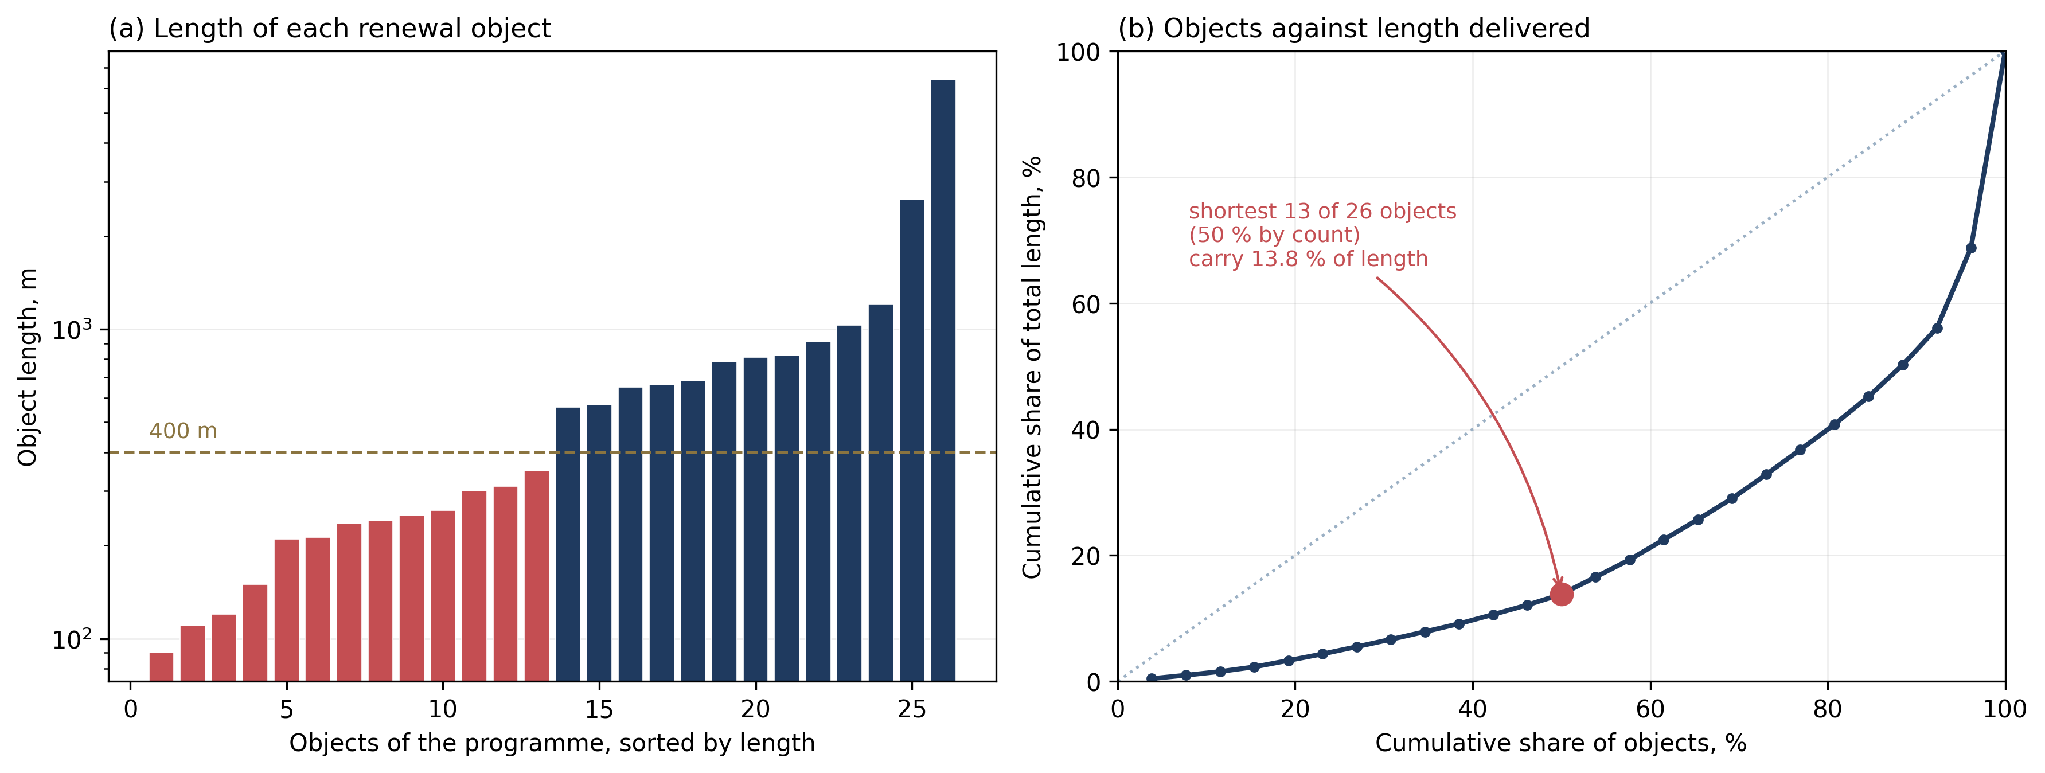
The distribution of object lengths in a real programme shows that this is not a marginal region of the parameter space (Figure 3). A municipal investment programme comprises 26 linear objects totalling 20,529 m, with a median of 454.5 m and a range from 90 to 6,400 m; thirteen of the twenty-six, exactly half by count, are no longer than 400 m and together account for 13.8 per cent of the total length. Half the objects, and therefore roughly half the street openings, deliver 13.8 per cent of the metres.
The admissibility result closes the argument. The classes that dominate at short object lengths, the per-opening class and the length-independent part of the per-receptor class, are the two that renewal-planning models serve worst, though not in the same way: the per-receptor class is reachable by no term these models declare, while the per-opening class is reachable through the aggregation and economies-of-scale terms and simply is not used to carry a cost falling outside the utility. A programme optimised on the criteria the literature supplies is therefore optimised over the classes that behave proportionally, and is silent on those that behave as a fixed charge per opening.
Whether grouping adjacent objects into a single occupation is worthwhile is then a question about the fixed component's magnitude relative to the constraints that resist grouping: seasonal windows for earthworks, permitting contours, crew capacity. The answer would have to come from a unit rate metered per street opening, which was not found in the reviewed corpus.
The corpus is purposive and bounded, and thirteen studies were read in full while the remainder were assessed from their reported results, so classification of the latter carries more uncertainty. Assignment is one reader's interpretation, recorded in Table 2 against each source's own statement of its unit of account, and the four classes are complete with respect to the units of account this corpus declares, not the field. No measurement of the author's own is reported anywhere, and no effect of any practice on any cost is claimed.
What the review establishes stands on the reviewed literature. Published estimates of the social cost of open-cut street works are tied to four distinct accrual quantities, and that difference is invisible in the categorical inventories through which the field presents itself; four of the nine registry entries declare no unit of account at all. Costs metered per street opening carry monetised evidence, including appraised savings of £1.51 million from combining occupations, yet no published unit rate for the opening itself was identified in the reviewed corpus. Costs metered per affected receptor carry a published monetary rate at the level of the dwelling and modelled evidence at the level of the establishment, and receptor counts are governed by network topology rather than trench length, as replacement plans ranging from 0.026 to 0.979 in isolation efficiency demonstrate. Against the terms that renewal-planning models declare, the per-extent class is admissible, the per-opening class only through aggregation terms that no study in the reviewed corpus uses to carry an external cost, the per-duration class only partially because the renewal budget term is annual, and the per-receptor class through no term declared by the models reviewed here, since the nine assessment metrics of a multicriteria rehabilitation study are borne, every one of them, inside the utility. The social costs that accrue per opening and per receptor are therefore the ones that grow when a renewal programme is cut into shorter objects, and the ones its planning formalisms either cannot reach at all or reach only through terms no reviewed study has used to carry them.
This review received no external funding.
The author directs a contracting organisation carrying out reconstruction and construction of water distribution and trunk networks by the open-cut method, as a subcontractor to water utilities and concession operators. The subject of this review is therefore the author's own field of commercial activity, and that position is the source of the practitioner observations in Section 1. No funding or other input from any client, supplier or industry body was received for this work.
This review reports no new measurements. All quantitative values are drawn from the published studies cited and can be located in their full texts. The distribution in Figure 3 was taken from a publicly issued municipal investment-programme resolution.
The manuscript underwent Double-Anonymous Peer Review by at least two independent subject-matter reviewers in accordance with the current editorial policy of IAE Review. The author is not affiliated with the journal's editorial office or publisher; the final publication decision was made by the editorial office.
27 references
Lazarev, I. S. (2026). Fixed and variable components of social cost in open-cut pipeline renewal. IAE Review. IAE‑2026‑OCP‑001. https://iaexperts.com/en/journal/sotsialnye-izderzhki-otkrytoy-perekladki-truboprovodov
About the author
Founder and Director, Lazarev (sole proprietorship) · water supply and sanitation; construction project management
A new approach to the data analyst profession: end-to-end ownership of analytical data flowsAleksandr Vasilchenko An AI-supported employee-driven performance management system: a conceptual model
 Tatiana Stetskaia
 Green building in residential development: principles, certification systems and economic rationale
 Vasilii Maslov
Journal
Submit your manuscript in Russian or English as DOCX, PDF or LaTeX through the submission form. Initial decision within 7 business days.